

Among the most biologically diverse of Earth’s ecosystems, wetlands cover only ∼5% of the Earth’s ice-free land surface but exert major impacts on global biogeochemistry, hydrology, and wildlife diversity. Encompassing systems ranging from inundated forests, swamps, lakes, rivers, saltmarshes, mangroves, and poorly-drained permafrost, wetlands dominate the global methane cycle through their sensitivity to interannual and longer-term climate fluctuations and play a unique role in the transformation of biogeochemical material and as wildlife habitats for numerous species. Inundated wetland areas’ extent and seasonal, interannual, and decadal variation play key roles in ecosystem dynamics.
Wetlands can be swamps, marshes, bogs, or fens. Despite the importance of these biomes in the global cycling of carbon and water and to current and future climate, and in part because of their complexity and inaccessibility, much about wetlands remains to be discovered, including how much of the planet they occupy and details of how they affect and are affected by climate. Remote sensing gives scientists powerful tools for collecting data on wetlands distribution and dynamics. These data enable researchers to map habitats, identify vegetation types, time the rise and fall of water levels, and more. Spaceborne microwave sensing is particularly sensitive to surface water and vegetation structure, supporting monitoring large, inaccessible areas over time regardless of atmospheric conditions or solar illumination.
NASA MEaSUREs Data Through ASF DAAC
Through the MEaSUREs (Making Earth System Data Records for Use in Research Environments) program, NASA supports developing and distributing Earth System Data Records (ESDR), developed from remote sensing datasets and expanding understanding of the Earth system. Emphasis is placed on linking observations from multiple satellites into coherent time series datasets. MEaSUREs projects generate coherent time series datasets and facilitate the synthesis of datasets to develop comprehensive Earth system models. MEaSUREs products are subject to rigorous standards for data quality, validation, algorithm description, documentation, and delivery.
ASF archives and distributes the ESDR datasets from the NASA Inundated Wetlands MEaSUREs project. These inundated wetlands ESDR datasets facilitate investigations on the role of wetlands in climate, biogeochemistry, hydrology, and biodiversity.
This landmark, high-resolution map of Alaska wetlands, published in 2009, was created with mosaics of ALOS PALSAR imagery. © JAXA 1993-1998
Click to download the high-resolution map
The inundated wetlands ESDR consists of two primary components:
- Fine-resolution maps of wetland extent, vegetation type, and seasonal inundation dynamics derived from Synthetic Aperture Radar (SAR) for regional and continental-scale areas covering crucial wetlands systems. These are created using data from a variety of spaceborne SARs, including the Japan Aerospace Exploration Agency (JAXA) Phased Array L-Band SAR (PALSAR) sensor mounted on the Advanced Land Observing Satellite (ALOS) and the associated follow-on and predecessor missions ALOS-2 PALSAR-2, and JERS-1 (the Japanese Earth Resources Satellite-1), respectively. The wetlands datasets were generated using algorithms appropriate to the nature of the wetlands systems under study, including time series and statistically based tree classifiers.
- Global, coarse-resolution time series mappings of inundated area fraction at ~25 km resolution derived from multiple satellite remote sensing observations, including passive and active microwave sensors and optical data sets optimized for inundation detection. The algorithm employed in generating this dataset employs a clustering model and a mixture model in the classification of fractional inundated areas. These datasets are provided bi-monthly for 1992-1999 and daily for 2000 onward. Annual summary products are provided, including the maximum inundated extent and annual inundation duration. A daily near real-time (NRT) dataset with 2-3 day latency is also provided.
MEaSUREs at NASA DAACs
ASF focuses on synthetic aperture radar data as one of 12 theme-based NASA Earth science data centers in the nation known as Distributed Active Archive Centers (DAACs). The DAACs are major components of the Earth Observing System Data and Information System (EOSDIS), part of NASA’s Earth Science Data Systems (ESDS) Program.
Links to additional MEaSUREs data at ASF and other DAACs:
- ASF Arctic MEaSUREs : Small-scale kinematics and deformation of Arctic sea ice
- USGS Land Processes DAAC
- Precipitation Processing System
- Goddard Earth Sciences Data and Information Services Center
- NASA Distributed Active Archive Center (DAAC) at NSIDC
- Ocean Biology Processing Group
- Atmospheric Science Data Center at Langley Research Center
- JPL Physical Oceanography DAAC
Spaceborne Remote Sensing Instruments Used for Monitoring Wetlands
Spaceborne microwave remote sensing offers effective tools for characterizing wetlands, as microwave sensors are particularly sensitive to surface water and to vegetation structure, allowing monitoring of large, inaccessible areas on a temporal basis regardless of atmospheric conditions or solar illumination. Inundated wetlands can be consistently mapped and characterized with microwave remote sensing instruments, employed alone or in combination.
Synthetic Aperture Radar (SAR)
ALOS PALSAR, ALOS-2 PALSAR-2, JERS-1
The Phased Array type L-Band Synthetic Aperture Radar (PALSAR) was one of the three remote-sensing instruments onboard the Advanced Land Observing Satellite (ALOS) launched in January 2006 by the Japan Aerospace Exploration Agency (JAXA) for characterizing land cover and for disaster monitoring. ALOS PALSAR operated until 2011. Its successor, ALOS-2 PALSAR-2 was launched in May 2014 and is currently operational. Its predecessor, the Japanese Earth Resources Satellite-1 (JERS-1) operated from 1992 through 1998.
The SAR instruments used by the JERS-1, ALOS PALSAR and ALOS-2 PALSAR-2 missions are active L-band (~1.25 GHz) microwave sensors capable of operating day and night over any weather. PALSAR and PALSAR-2 support Fine Beam and ScanSar data collection modes that allow the sensor to acquire fine-resolution data or large swaths of multi-temporal acquisitions at reduced spatial resolution. In addition, PALSAR and PALSAR-2 can acquire fully polarimetric SAR imagery. Such technology allows for a variety of applications ranging from the determination of soil moisture and vegetation classification, to the monitoring of environmental disasters.
Sentinel-1
The ESA Sentinel-1 mission is composed of two satellites, Sentinel-1A and Sentinel-1B, that carry C-band (5.4 GHz) SAR instruments. The first satellite, Sentinel-1A, was launched in April 2014, and Sentinel-1B was launched in April 2016. Both are currently operational. There are a wide range of applications for the data collected via the Sentinel-1 mission, including sea and land monitoring, emergency response due to environmental disasters, and economic applications.
Coarse-Resolution Active and Passive Microwave Sensors
AMSR-E, AMSR-2
The Advanced Microwave Scanning Radiometer (AMSR) has operated on two satellite platforms:
- AMSR-E operated on NASA’s EOS Aqua spacecraft, launched May 4, 2002. The instrument ceased effective operation on Oct 4, 2011.
- AMSR-2 is deployed on-board JAXA’s GCOM-W1 spacecraft, launched May 18, 2012. This instrument is currently operating.
The AMSR instruments are multi-frequency, dual-polarization, conically scanning passive microwave radiometers providing global-scale diurnal sampling. The primary objective of these missions is to gather large-scale information about Earth’s water systems, acquiring data for analysis of global precipitation, evaporation, and the cycling of water. Such information is vital for scientists around the world seeking a better understanding of Earth’s water cycle and its dependence on global climate.
SSM/I and SSMIS
The Special Sensor Microwave Imager (SSM/I) and the Special Sensor Microwave Imager Sounder (SSMIS) are passive microwave radiometers. These radiometers have been deployed on-board the Defense Meteorological Satellite Program (DMSP) series of satellites since 1987 with the series currently on-going.
ERS-1, ERS-2
The European Space Agency’s (ESA) two European Remote Sensing (ERS) satellites, ERS-1 and –2, were launched in 1991 and 1995 respectively. Their payloads included a microwave sensor package that supports SAR imaging, radar scatterometry, and radar altimetry. The ERS-1 mission ended in March 2000 and ERS-2 was retired in September 2011.
QuikSCAT
The SeaWinds instrument on NASA’s Quick Scatterometer (QuikSCAT) was used as a “quick recovery” mission to fill in the data gap that resulted when the satellite carrying NASA’s scatterometer (NSCAT) lost power in June 1997. QuikSCAT was launched in June 1999 and the mission officially ended in Nov 2009. It was a specialized microwave radar with a rotating dish antenna providing scatterometer measurements at 13.4 GHz. The instrument acquired global data over a continuous, 1,800 km-wide swath covering 90 percent of Earth’s surface each day.
ASCAT
The first Advanced Scatterometer (ASCAT) was launched on ESA’s EUMETSAT MetOp-A satellite in October 2006. A second ASCAT instrument became operational on MetOp-B, launched in September 2012. Both currently operational, MetOp-A and MetOp-B carry identical ASCAT instruments. The main objective of ASCAT is the measurement of wind speed and direction over the oceans, though ASCAT is also used for studying polar ice, soil moisture, surface hydrodynamics, and vegetation. ASCAT is a C-band scatterometer with two sets of three vertically polarized antennas, with a set extending on each side of the instrument, resulting in dual swath observations, each swath being about 500 km wide.
Wetlands Project Personnel
Principal Investigator:
Kyle C. McDonald, Ph.D.
Terry Elkes Professor, Department of Earth and Atmospheric Sciences
CUNY Environmental Crossroads Initiative and CREST Institute
The City College of New York, City University of New York
MR 925, 160 Convent Ave. & W. 138th St., New York, NY 10031 USA
Phone: 212-650-8218; Mobile: 818-434-8937; FAX: 212-650-7064
AND
Jet Propulsion Laboratory, California Institute of Technology
4800 Oak Grove Drive; Pasadena, California 91109-8099 U.S.A.
Project Members
- Bruce Chapman (JPL)
- Laura Hess (University of California, Santa Barbara)
- Mahta Moghaddam (University of Michigan)
- John Kimball (University of Montana)
Collaborators
- Dr. Martti Hallikainen (Helsinki University of Technology)
- Ake Rosenqvist (JRC — Italy)
- Masanobu Shimada (EORC-JAXA — Japan)
- Max Finlayson (International Water Management Institute)
- Nick Davidson (Ramsar)
- Wenjun Chen (CCRS)
- Albert Jimenez (Columbia University)
- Adane Metaferia (California State University, Chico)
Time Series Animation
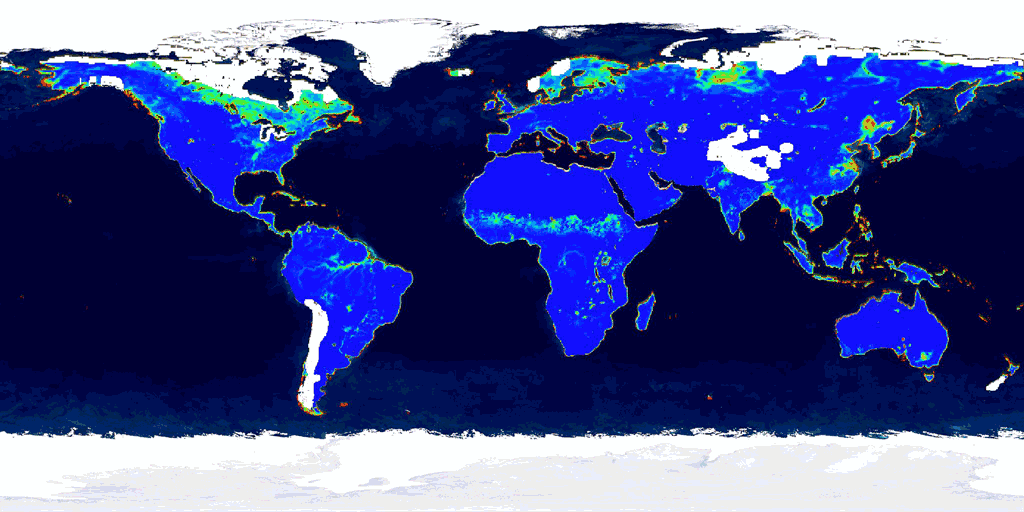
This time series animation, produced at ASF, reveals changing patterns of global wetlands inundation from 2002 to 2009 at approximately 25 km resolution. In addition to providing an overview of global wetlands cycling, the animation enables researchers to identify regions for further investigation.
The products used in this animation were derived from multiple satellite observations, including coarse-resolution active and passive microwave and optical data (e.g., ERS and QuickSAT scatterometers, AVHRR, and MODIS) optimized specifically for inundation detection.
Time Series Data
The Wetlands MEaSUREs time series data are currently unavailable. We apologize for the inconvenience. Please contact ASF User Support with any questions.
Satellite data products are available to users through ASF under NASA’s open-access data policy. These data products are available for direct download. View downloaded GeoTIFFs in GIS software such as QGIS (open source) or ArcGIS.
A description of the datasets available for each region is provided below the tables.
GLOBAL
| Dataset | Sensors | Dates | Data | Image preview |
|---|---|---|---|---|
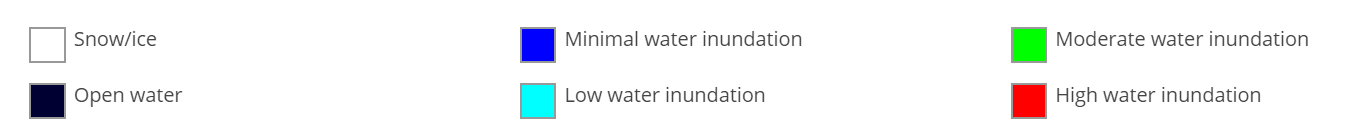
| SWAMPS v3.2 Daily (2000-2020) Bi-monthly (1992-1999) | SSM/I, SSMIS, ERS, QuikSCAT, ASCAT | 1992‑2020 | Download | 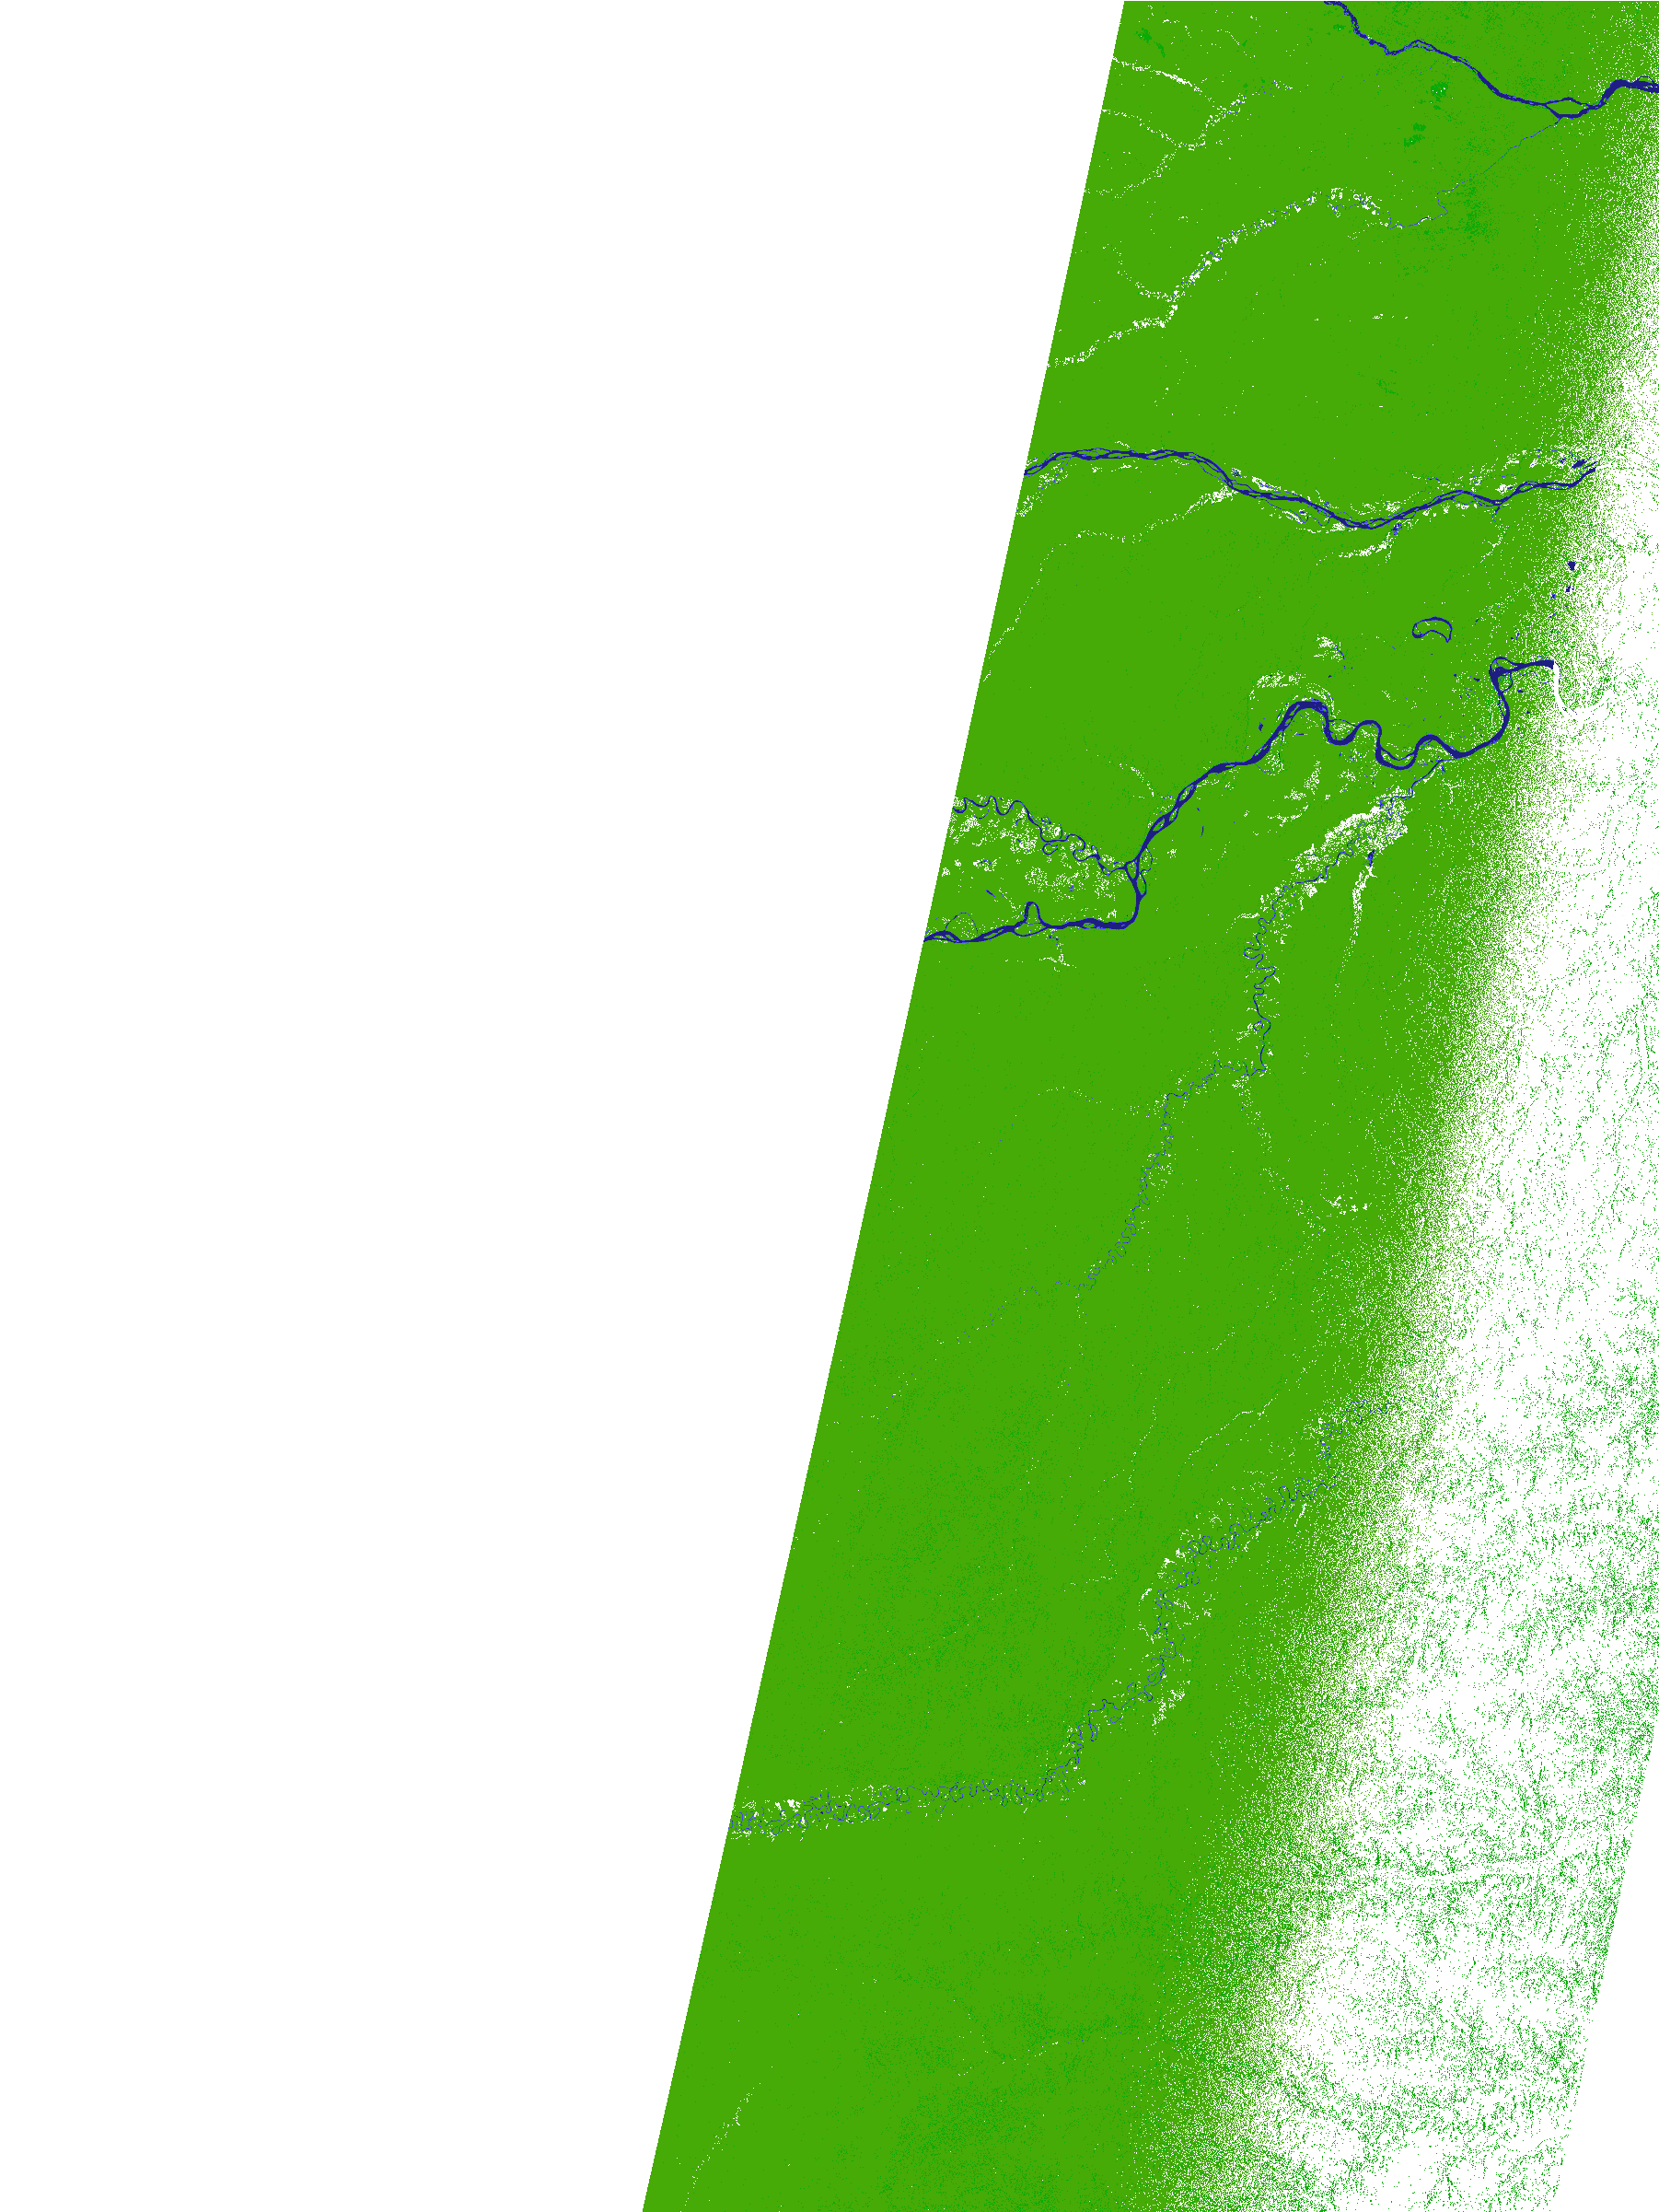 |
| SWAMPS v2.0 | AMSR-E, QuikSCAT | 2002‑2009 | GeoTIFF ENVI | |
NORTH AMERICA
| Dataset | Sensors | Dates | Data | Image preview |
|---|---|---|---|---|
| Summer Backscatter Mosaic | JERS-1 | 1998 | Download |  |
| Summer Texture Mosaic | JERS-1 | 1998 | Download |  |
| Winter Texture Mosaic | JERS-1 | 1997-1998 | Download | 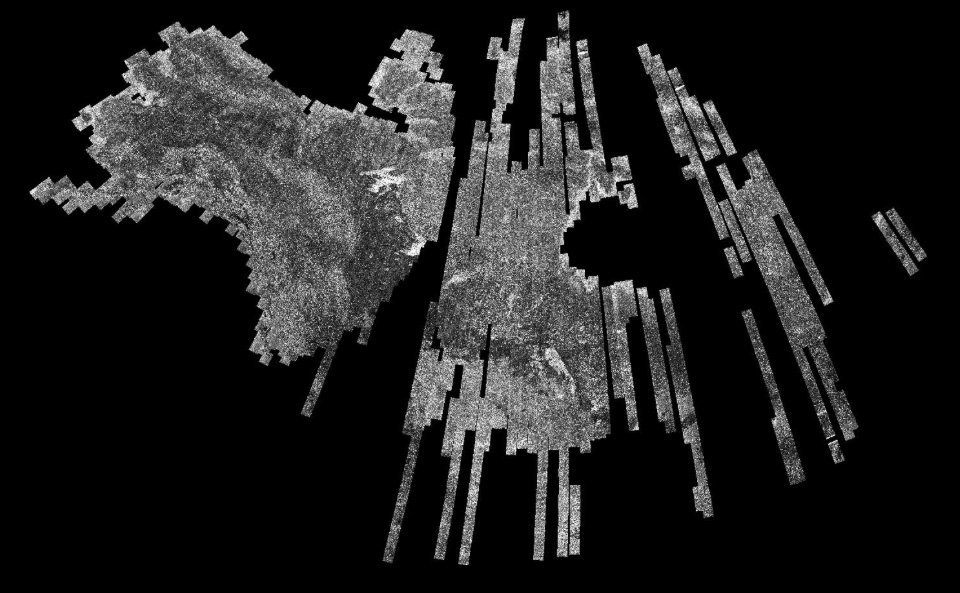 |
ALASKA
| Dataset | Sensors | Dates | Data | Image preview |
|---|---|---|---|---|
| PALSAR Wetlands Map | ALOS PALSAR | 2007 | GeoTIFF | KEA file | 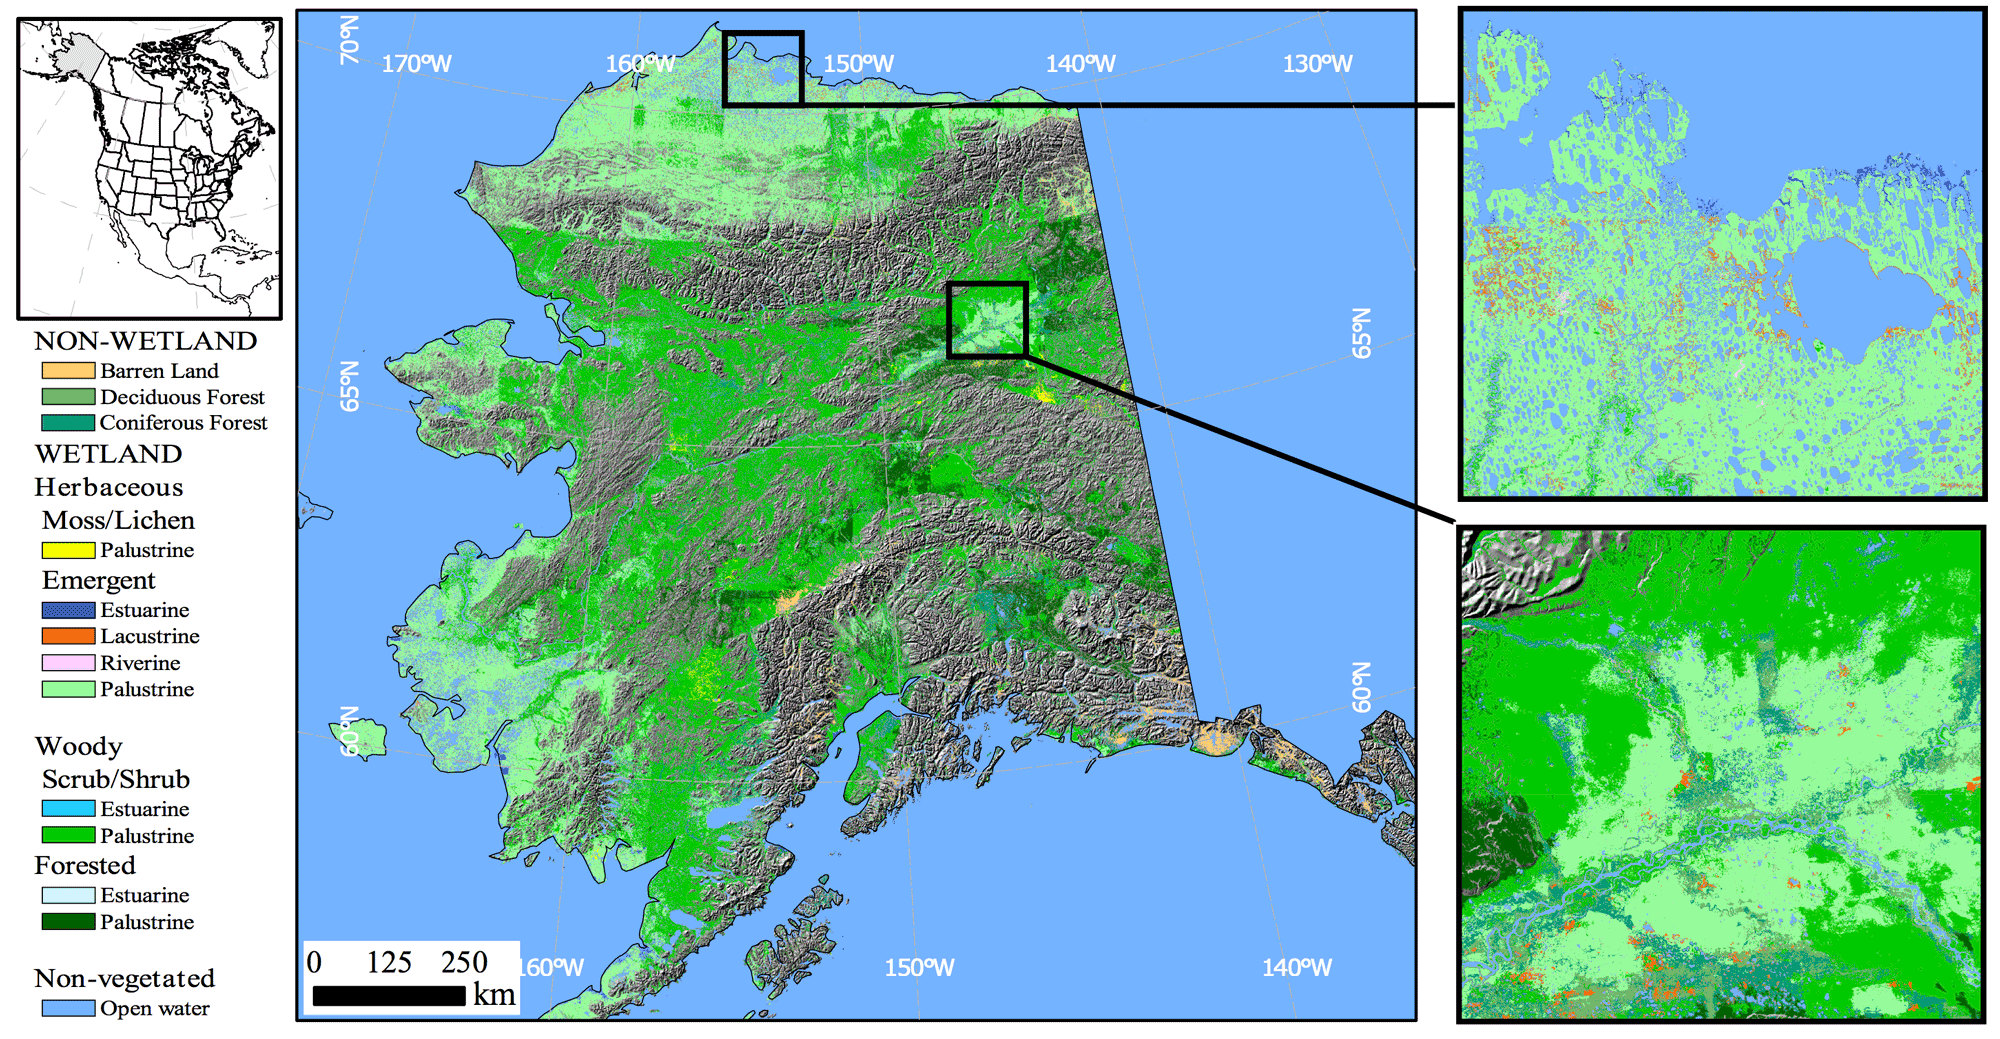 |
| JERS-1 Wetlands Map | JERS-1 | 1997-1998 | Download |  |
SOUTH AMERICA (Amazon Basin)
| Dataset | Sensors | Dates | Data | Image preview |
|---|---|---|---|---|
| South America (Amazon) | JERS-1 | Mid-1996 | Download | 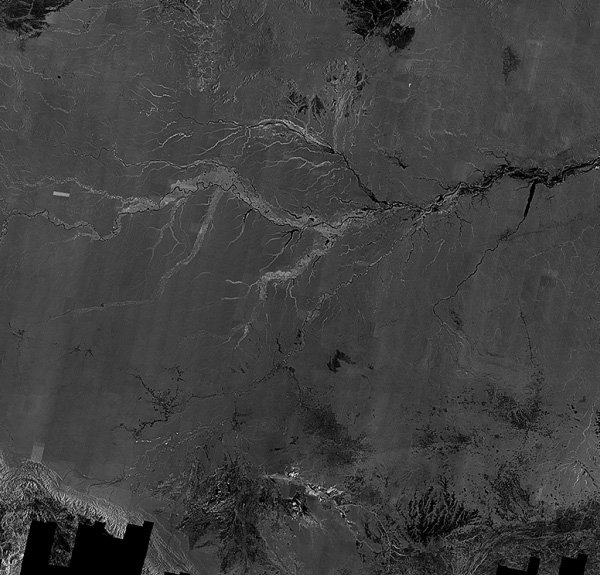 |
| Amazon JERS-1 Low Flood Mosaic | JERS-1 | Late 1995 | Download | 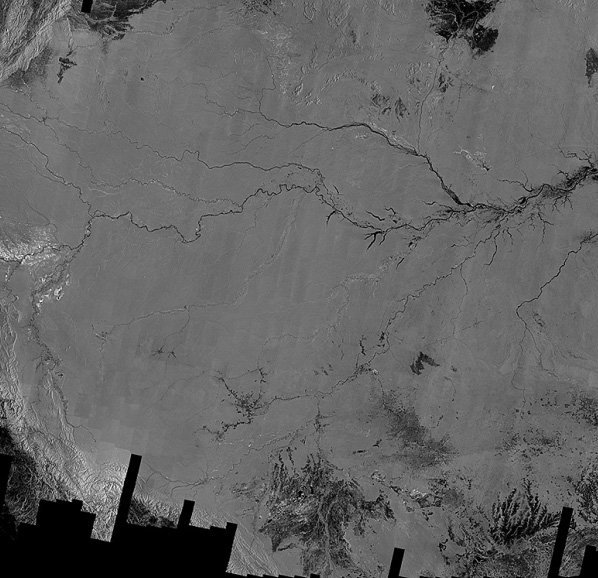 |
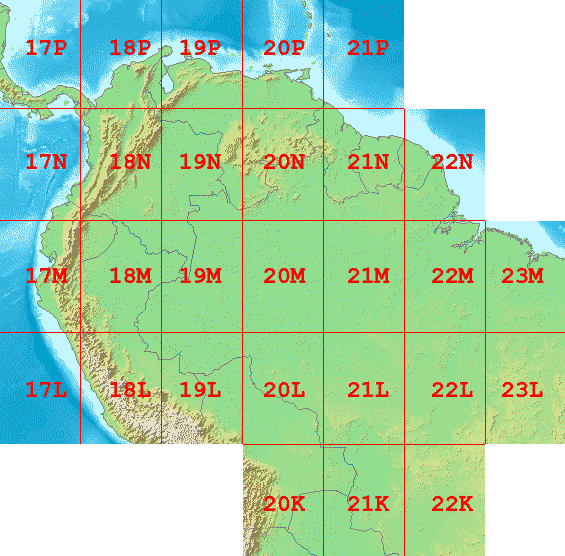
| Amazon PALSAR Wetland Extent Maps | PALSAR | 2006-2011 | Product Map | |
Amazon PALSAR Wetland Extent Tiles
17L, 17M, 17N, 17P, 18L, 18M, 18N, 18P, 19L, 19M, 19N, 19P, 20K, 20L, 20M, 20N, 20P, 21K, 21L, 21M, 21N, 21P, 22K, 22L, 22M, 22N, 23L, 23M
Surface WAter Microwave Product Series (SWAMPS)
A gridded global surface water fraction product derived from combined passive-active microwave datasets (SSM/I, SSMIS, ERS, QuikSCAT, ASCAT). This dataset is derived using a land cover-supported, atmospherically-corrected dynamic mixture model applied to 20+ years of combined, daily, passive/active microwave remote sensing data.
Two product types are available
(1) Stable (better quality for analysis): Datasets updated monthly once all supporting input data are available. Data from 1992-1999 are bi-monthly. Data from 2000 onward are daily. Summary data include annual maximum and minimum inundation extent and annual inundation duration.
(2) Near-real time (for access to most recent observations): Daily data are available with 2-3 day latency.
Jensen K and McDonald KC (2019). Surface Water Microwave Product Series (SWAMPS) Version 3: A Near-Real Time and 25-year Historical Global Inundated Area Fraction Time Series from Active and Passive Microwave Remote Sensing. IEEE Geoscience and Remote Sensing Letters (Accepted).
Schroeder R, McDonald K C, Chapman B D, Jensen K, Podest E, Tessler Z D, Bohn T J, and Zimmermann R (2015). Development and evaluation of a multi-year fractional surface water data set derived from active/passive microwave remote sensing data. Remote Sensing, 7(12), 16688-16732.
North America JERS-1 Mosaics
L-band HH-polarized SAR backscatter mosaic from the NASDA/JAXA JERS-1 satellite.
Images Copyright (c) 1992-1998 NASDA/MITI Courtesy of the Global Rain Forest Mapping (GRFM) project. The JERS-1 SAR data, images and text are only intended for scientific and/or educational use. Any other use is prohibited under the terms of the NASDA/MITI copyright. If you wish to publish these images for scientific or educational purposes, no permission is required and there is no charge. Please acknowledge the origin of the data by adding “Courtesy of GRFM, (c) NASDA/MITI” below any image published.
More about the GRFM project:
- Rosenqvist A., Shimada M., Chapman B., Freeman A., De Grandi G., Saatchi S., Rauste Y., “The Global Rain Forest Mapping project – a Review,” International Journal of Remote Sensing 21, no. 6&7 (2000): 1375-87.
- Rosenqvist et al., International Journal of Remote Sensing (special issue devoted to the GRFM project) 23, no. 7 (2002).
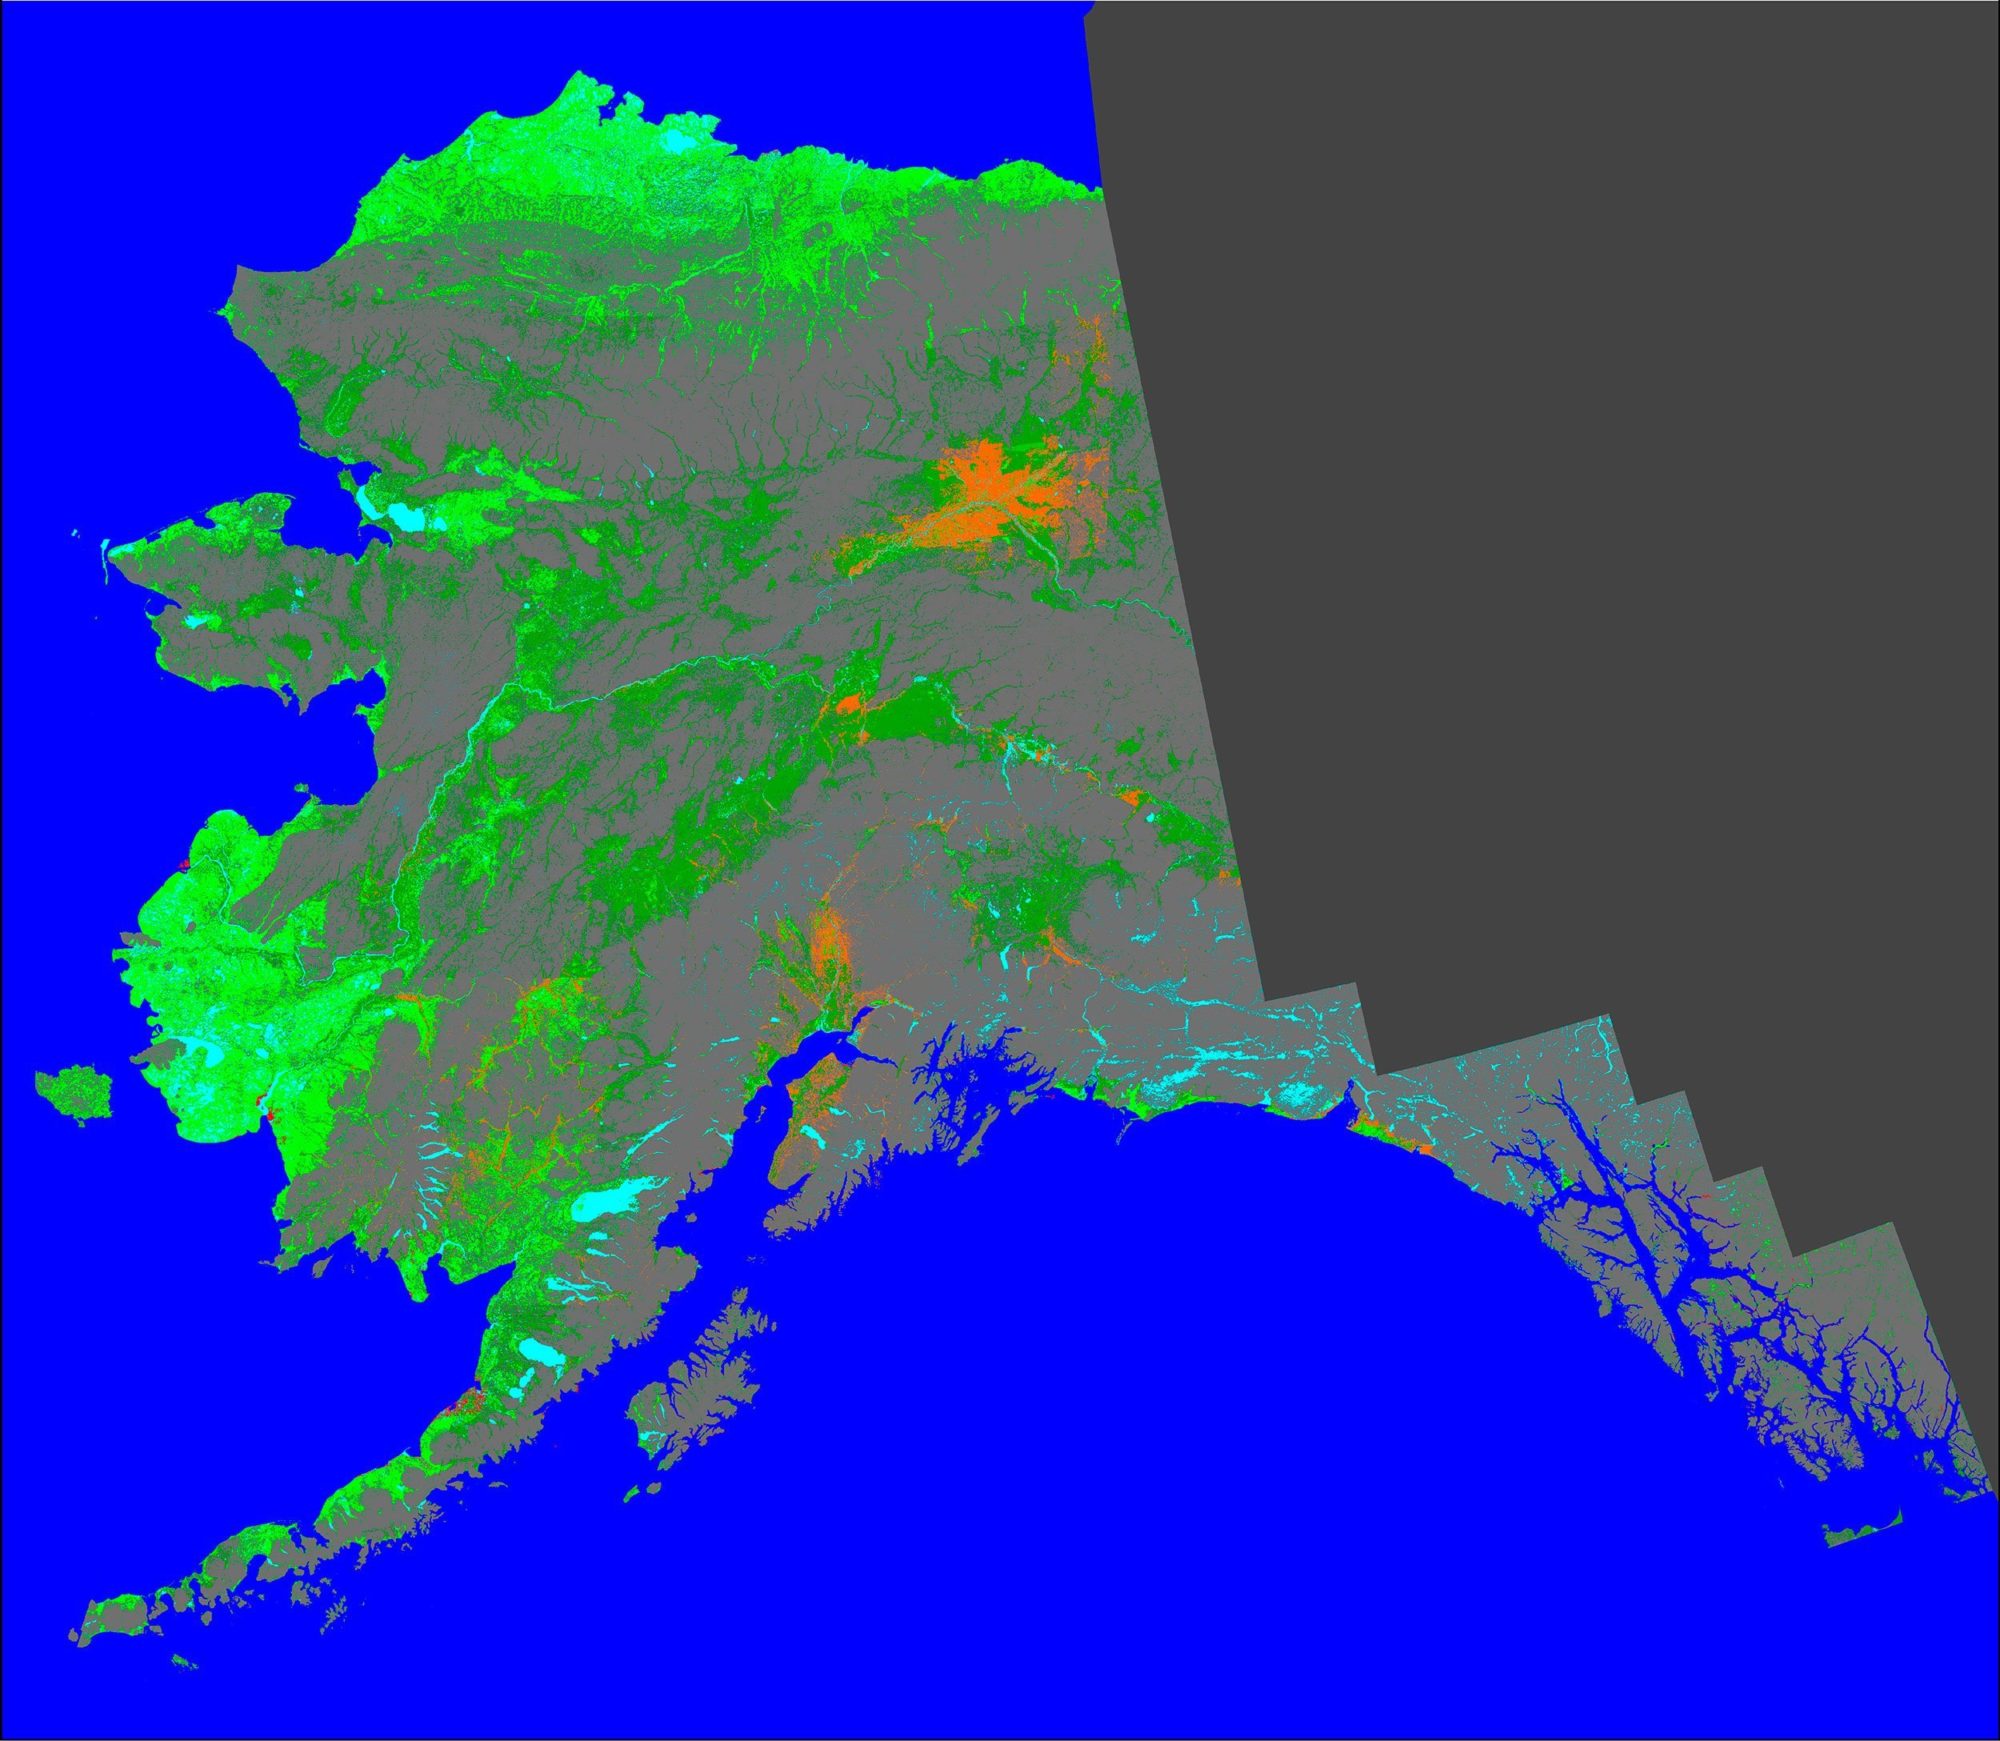
Alaska Wetlands Map derived from ALOS PALSAR fine beam data
ALOS PALSAR – High-resolution map of Alaska wetlands. ALOS PALSAR map of wetlands in Alaska with a spatial resolution of 50 meters.
Clewley, D., Whitcomb, J., Moghaddam, M., McDonald, K., Chapman, B., Bunting, P. 2015. “Evaluation of ALOS PALSAR Data for High-Resolution Mapping of Vegetated Wetlands in Alaska,” Remote Sensing, no. 7: 7272-7297, doi: 10.3390/rs70607272.
Clewley, D., J. Whitcomb, M. Moghaddam, and K. McDonald, “Mapping the State and Dynamics of Boreal Wetlands using Synthetic Aperture Radar,” in Remote Sensing of Wetlands: Applications and Advances, R. Tiner, M. Lang and V. Klemas (Eds.), CRC Press, March 2015. ISBN 9781482237382.
Alaska Wetlands Map derived from JERS-1 SAR
JERS-1-Landmark, high-resolution map of Alaska wetlands, published in 2009.
The Far North’s vast wetlands both absorb and emit significant amounts of gases involved in climate change—particularly carbon and methane. But as recently as 2008, scientists knew very little about the locations and extent of these often remote and inaccessible ecosystems. So researchers used mosaics of Japanese Earth Resources Satellite (JERS-1) synthetic aperture radar (SAR) imagery to produce this landmark, high-resolution map of Alaska wetlands.
Whitcomb, J., M. Moghaddam, K. McDonald,J. Kellndorfer, and E. Podest, “Mapping Wetlands of Alaska from L-band SAR imagery,” Canadian Journal of Remote Sensing 35, no. 1 (February 2009): 54-72, doi: 10.5589/m08-080.
Amazon Low and High Flood Backscatter Mosaics from JERS-1 SAR
The entire Amazon basin was acquired during both the generally low flood time of the Amazon River in late 1995, and in mid-1996 during a high flood period of the Amazon river.
Contributing to the Global Rain Forest Mapping project, this L-band HH image mosaic below from the NASDA/JAXA JERS-1 SAR has a pixel spacing of 3 arcseconds (about 100 m). The imagery has been enhanced to emphasize the backscatter signature of inundated wetlands. This version of the image mosaic has been corrected for orthorectification errors by Yongwei Sheng, and Douglas E. Alsdorf (Ohio State University). Black areas in this image generally correspond to open water, dark grey to low vegetation, grey to forest or shrublands, and light grey to white to inundated forests or shrublands, or to urban areas. This portion of the dataset covers an area of about 8 million km2 comprising some 2000 NASDA frame images. The same area was covered again in May – August 1996, during a high flood period of the Amazon river.
More on orthorectification of this image mosaic:
- Yongwei Sheng, Alsdorf, D.E., “Automated Georeferencing and Orthorectification of Amazon Basin-Wide SAR Mosaics Using SRTM DEM data,” Geoscience and Remote Sensing, IEEE Transactions on , vol.43, no.8 (Aug. 2005): pp. 1929- 40, doi: 10.1109/TGRS.2005.852160.
More about the GRFM project:
- Rosenqvist A., Shimada M., Chapman B., Freeman A., De Grandi G., Saatchi S., Rauste Y., “The Global Rain Forest Mapping project – a Review,” International Journal of Remote Sensing 21, no. 6&7 (2000): 1375-87.
- Rosenqvist et al., International Journal of Remote Sensing (special issue devoted to the GRFM project) 23, no. 7 (2002).
Time-series Amazon Wetlands Extent Maps derived from PALSAR ScanSAR data
ALOS PALSAR ScanSAR – Classified open water and inundated vegetation of the Amazon Basin 2006-2011; 100m resolution; GeoTIFF tiles, named by UTM zone location.
Chapman, B.; McDonald, K.; Shimada, M.; Rosenqvist, A.; Schroeder, R.; Hess, L. Mapping Regional Inundation with Spaceborne L-‐Band SAR. Remote Sens. 2015, 7, 5440-‐5470.