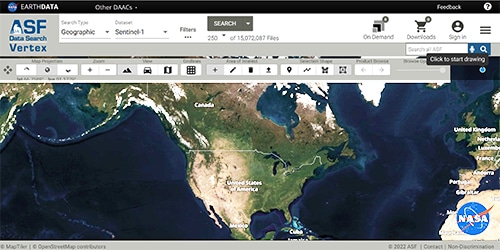
Glacier surface velocities were derived using ALOS PALSAR fine beam data (L-Band, HH Polarization, 46-day orbit interval) provided through ASF. Repeat image pairs, acquired within one- to two-orbit intervals, were used to measure the ground displacement of features on glacier surfaces, such as crevasses or Synthetic Aperture Radar (SAR) speckle. Ground displacement was measured using image cross correlation, which provides estimates of flow speed both in azimuth and range directions. Displacements were calculated from slant-range Single Look Complex (SLC) files, then geocoded, topographically corrected, and corrected for image co-registration.
The final data products released here provide highly accurate estimates of flow speed; uncertainties are generally below 2 cm/day and overall biases are < 3 mm/day. While the data products are gridded at 90 m resolution, the method’s true spatial resolution is about three times larger due to the size-correlation windows. Nonetheless, these data are still able to resolve flow on Alaska glaciers of all sizes and speeds.
Region and timing: The dataset includes flow speeds of glaciers in the Wrangell-St. Elias Mountains, the Chugach Range, Kenai Peninsula, the Tordrillo and Necola Ranges, the Fairweathers, the Alaska Range, Glacier Bay, and the Coast Mountains of Southeast Alaska. Custom software was used to manually identify which of 344 image pairs could best represent each glacier and then mosaic chosen velocity fields together. In total, about 60 frames were chosen to produce the final maps. All images were acquired in winter between 2007 and 2010 (most were in January of 2008 and 2010). There were significant temporal changes in wintertime velocity, so continuity within each glacier basin was prioritized above optimal spatial coverage. Also, given the sometimes-erratic changes in velocity, the researchers caution against using these data to look at long-term trends in velocity.
Data format: The dataset available here includes geocoded grids of flow speed, metadata, and a Google Earth visualization of the full dataset for educators and scientists. The Google Earth visualization is self-explanatory for anyone with Google Earth. The metadata include geocoding information and the acquisition timing of the mosaicked flow-speed map.
For more information, see Burgess, E. W.; Forster, R.R.; and Larsen, C.F., Flow velocities of Alaskan glaciers. Nat. Commun. 4:2146 doi: 10.1038/ncomms3146 (2013).


