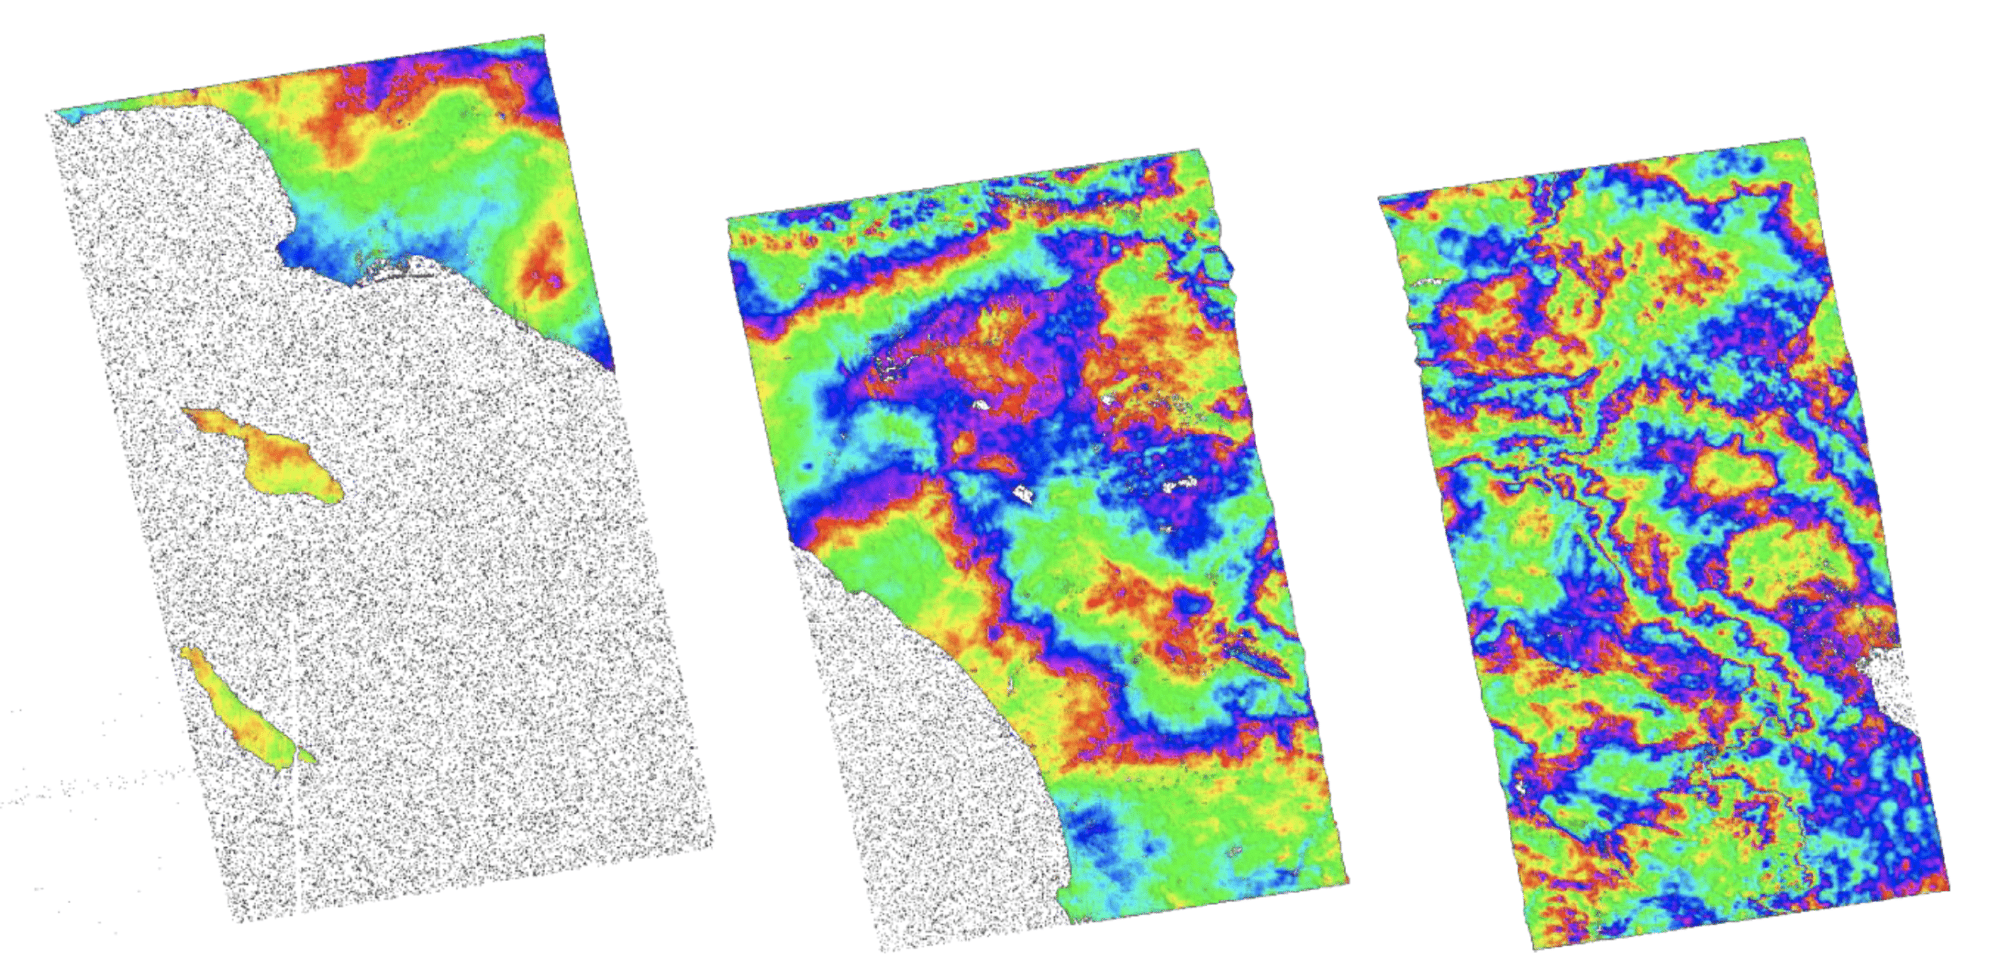
Script output images: color phase products for each swath F1, F2, F3. Contains modified Copernicus Sentinel data (2015) processed by ESA.
Source: ASF Staff
● Easy (AWS sign-up and configuration)
■ Intermediate (Set config and run script)
Background
In order to perform differential interferometry on Sentinel-1 data using the GMT5SAR software package, ASF provides the python script procS1GMTSAR.py. This script takes two Sentinel-1 IW SLC files and creates a differential interferogram of the data in both GeoTIFF and KMZ format. The user may specify an input DEM file (which must be in GMT GRD format) or a DEM file will automatically be downloaded for the user via the opentopo service. The script creates an interferogram for the main polarization, VV, only.
The Sentinel-1 granules must be in the directory where the script is run, i.e. the .zip files must be in the directory where you run the script. In addition, the ASF provided GMT5SAR configuration file, config.s1a.txt, must be in the same location as your executable file procS1GMT5SAR.py.
Required Pre-Steps
The How to Create and Unwrap an Interferogram with GMT5SAR Script in the Cloud — OS X recipe is the third and final part of a tutorial spanning multiple recipes.
Part 1: How to Configure AWS for Running the GMT5SAR InSAR Recipe
Prerequisites
Materials List:
- AMI (AWS East, ASF-INSAR-GMT5SAR)
- ASF config file: config.s1a.txt (home/Ubuntu)
- Python 2.7 (2.7.12-1ubuntu0~16.04.1)
- .netrc file (home/Ubuntu)
- GDAL (gdal-bin (2.1.3+dfsg-1~xenial2))
- Sample Granules (Two Sentinel-1 SLCs, IW, VV only)
S1A_IW_SLC 1SSV_20150526T014935_20150526T015002_006086_007E23_679A.zip
S1A_IW_SLC 1SDV_20150607T014936_20150607T015003_006261_00832E_3626.zip
- Sample granules located at /home/Ubuntu/SLC
- ASF script: procS1GMT5SAR.py
AMI Software Version Numbers:
python2.7 (2.7.12-1ubuntu0~16.04.1)
python-lxml (3.5.0-1build1)
python-requests (2.9.1-3)
gdal-bin (2.1.3+dfsg-1~xenial2)
libgdal-dev (2.1.3+dfsg-1~xenial2)
python-gdal (2.1.3+dfsg-1~xenial2)
csh (20110502-2.1ubuntu1)
subversion (1.9.3-2ubuntu1.1)
autoconf (2.69-9)
ghostscript (9.18~dfsg~0-0ubuntu2.7)
libfftw3-dev:amd64 (3.3.4-2ubuntu1)
libgmt-dev (5.2.1+dfsg-4ubuntu2~xenial2)
gmt (5.2.1+dfsg-4ubuntu2~xenial2)
Steps
Configure the script — from your EC2 Window
- Phase unwrapping on/off.
- Default unwrapping off (interferogram only): threshold_snaphu=0.0
- For unwrapping on, edit the config file in a text editor, set threshold_snaphu=0.2
- Edit the .netrc file.
- Phase unwrapping on/off.
To get the precision state vectors from ASF, you must edit the provided .netrc file.
Add your URS/Earthdata username and password (same as Vertex login):
cd /home/Ubuntu
vi .netrc
Add these lines:
machine urs.earthdata.nasa.gov
login <username>
password <password>
You are ready to create an interferogram!
Run the Script — Create an Interferogram
- Issue the following command to run the GMT5SAR process:
python procS1GMT5SAR.py<master granule name><paired granule name>
Notes:
- Use two Sentinel-1 SLCs, VV polarization only
- The master (older) granule must be first
- Use .zip or .SAFE files
- Script options:
- -h, – -help shows help message and exits
- -d DEM, – -dem <yourDEMfilename> User-specified DEM file (in GMT format). If not used, the script will pull a DEM for you.
- Prior to running the script a second time, delete or move unnecessary files.
Example:
python procS1GMT5SAR.py
S1A_IW_SLC 1SSV_20150526T014935_20150526T015002_006086_007E23_679A.zip
S1A_IW_SLC 1SDV_20150607T014936_20150607T015003_006261_00832E_3626.zip
The script will take about an hour. The three commands prefaced with “Running Interferogram:” takes the bulk of processing time. Expect to wait a significant amount of time for each of the calls to p2p_S1A_TOPS.csh to finish (as much as an hour per call).
Sample Images
Appendix 1: Steps the Script Completes
How it works:
- Unzip the input Sentinel-1 input granules.
- Download appropriate restituted state vectors.
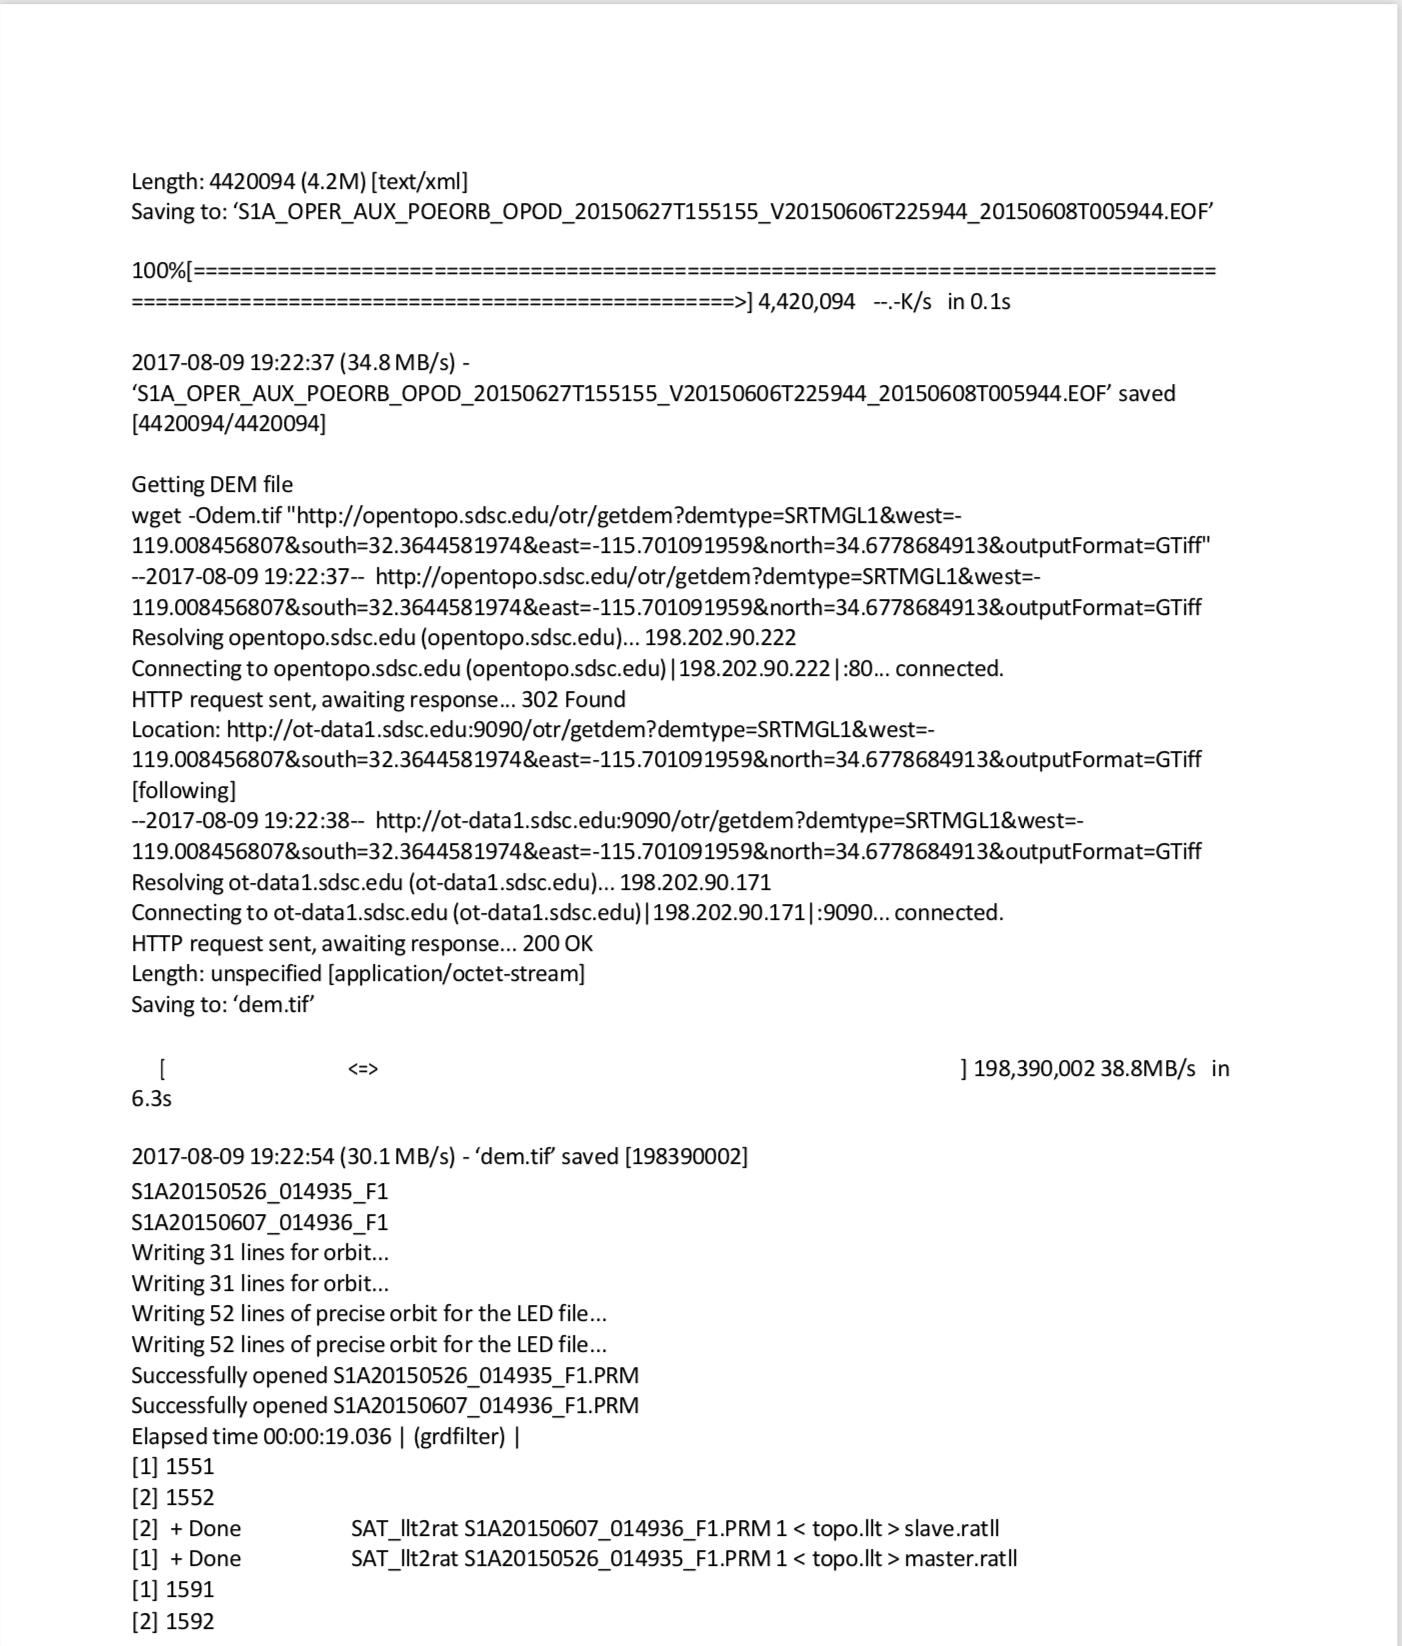
- Download DEM covering the area of the master image (OpenTopo or user-specified).
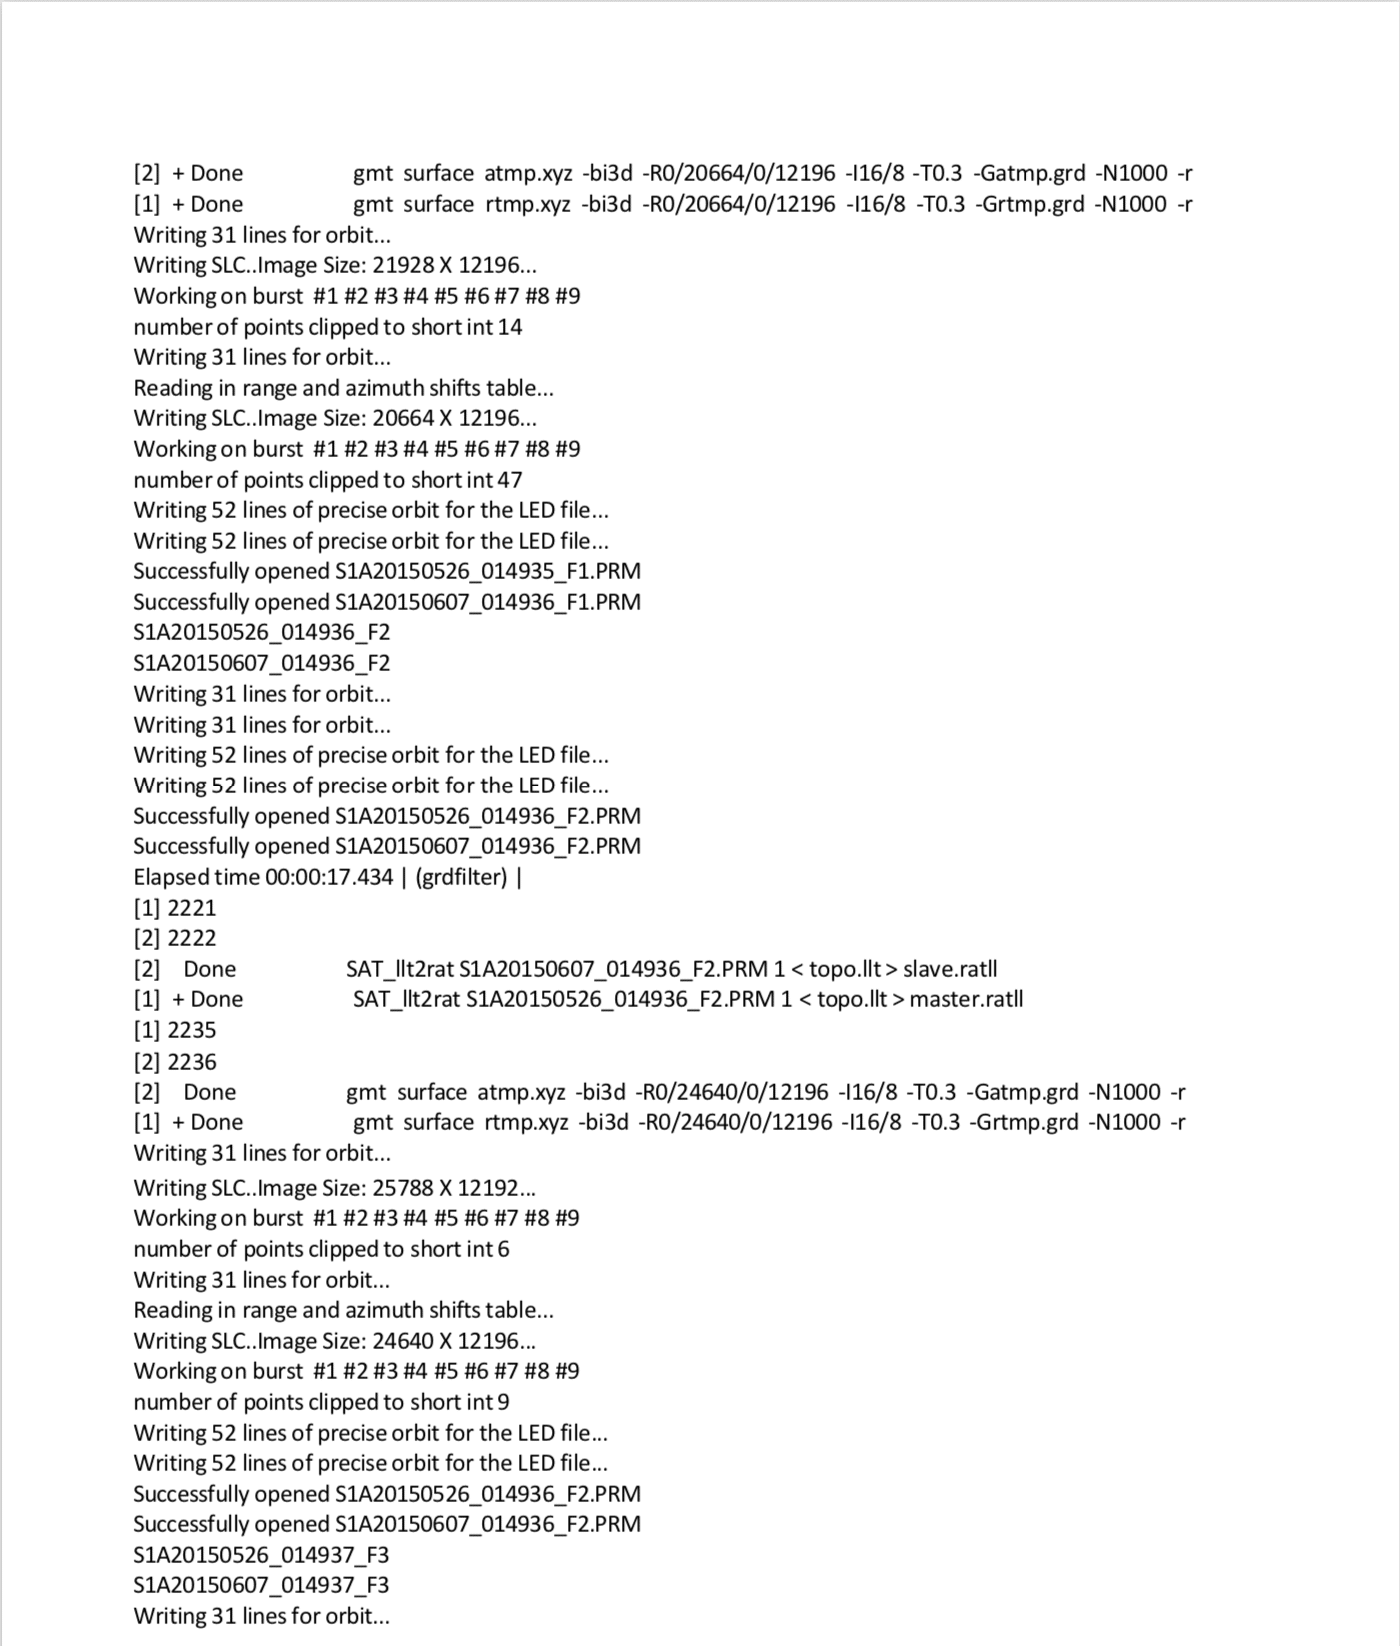
- Align the two images using the GMT5SAR script align_tops.csh.
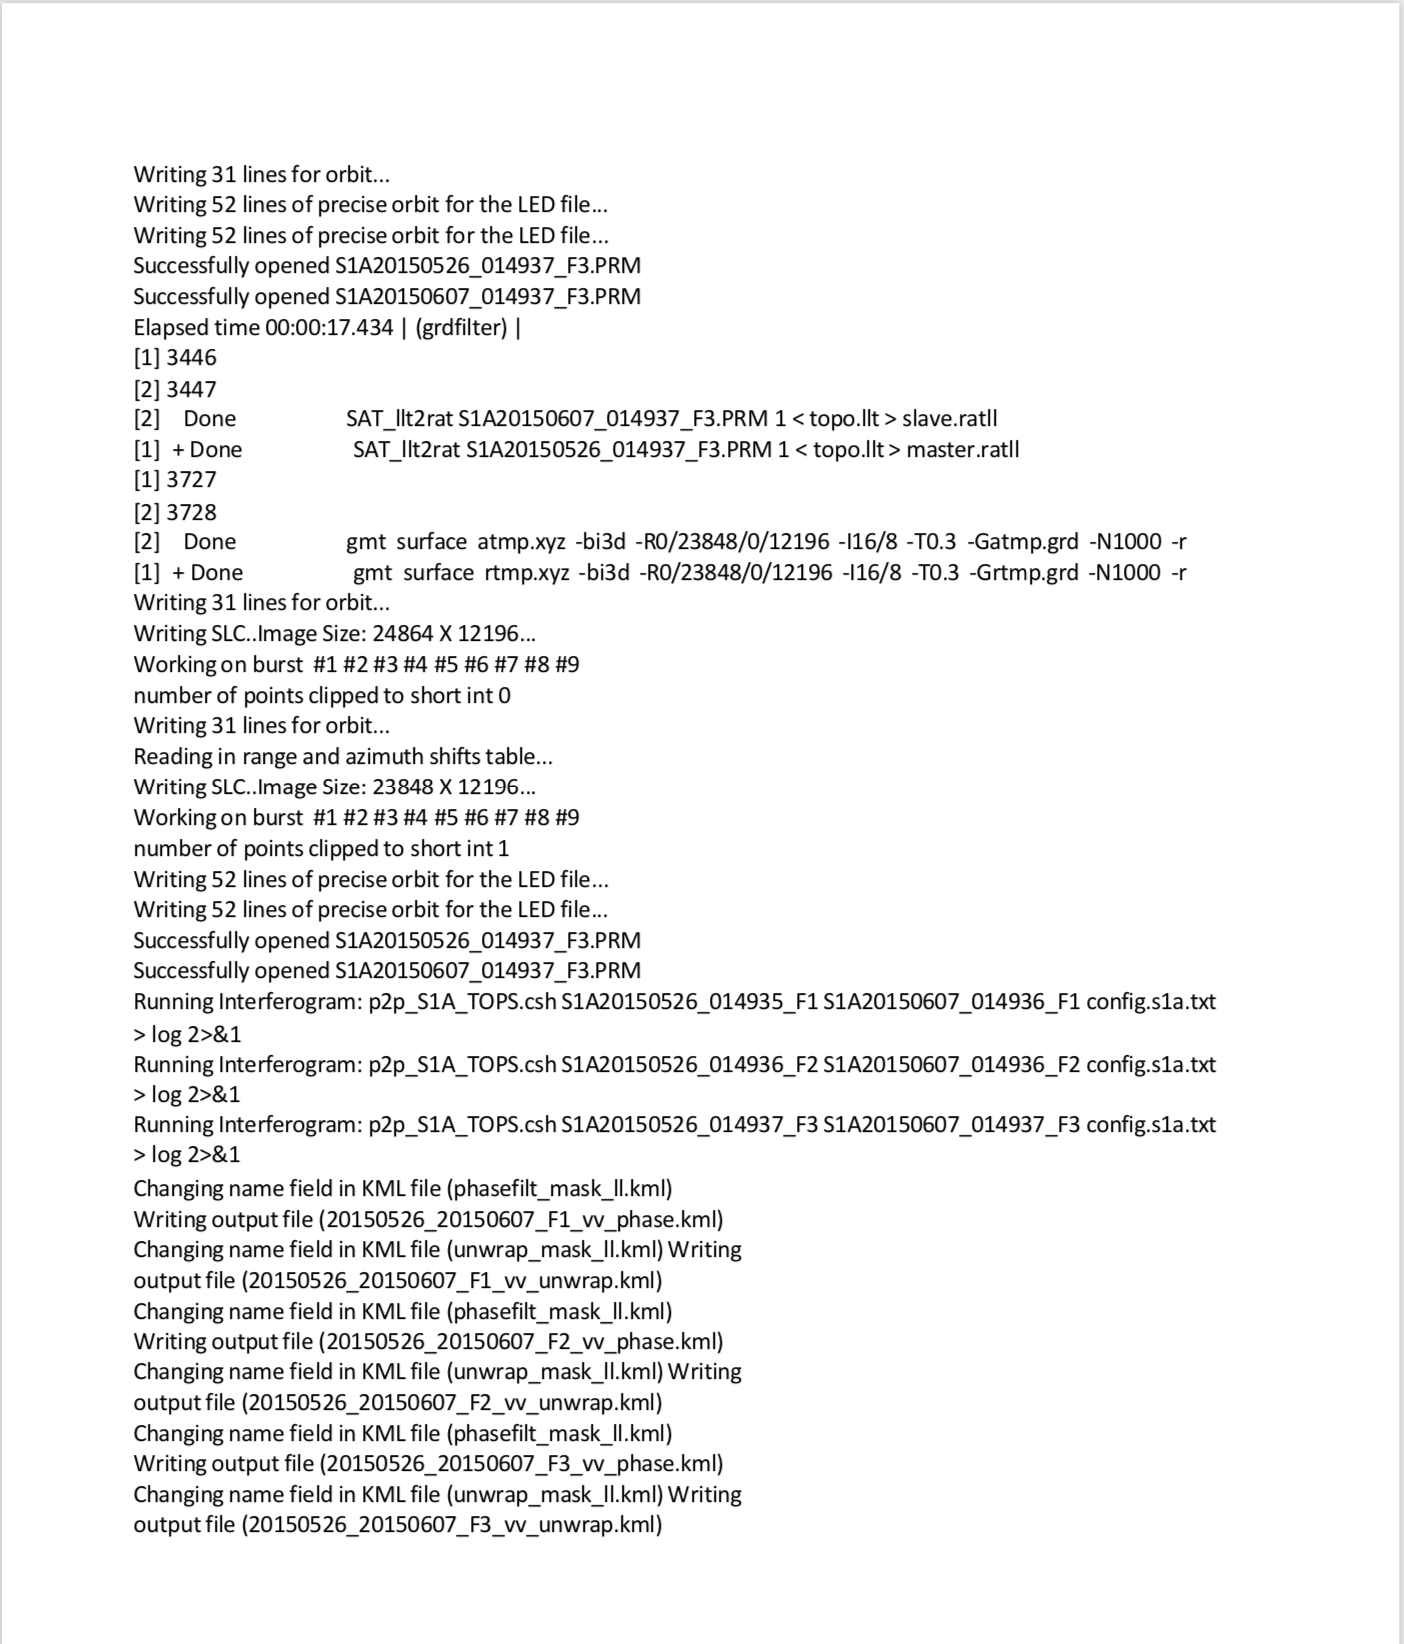
- Create the interferograms, optionally unwrap, using the GMT5SAR script p2p_S1A_TOPS.csh.
- Create and populate the PRODUCT directory.
Appendix 2: Script Output Files — Unwrapping on
The outputs of the run will be placed in a directory called PRODUCT, e.g. the output from the above run will produce a PRODUCT directory with the following files:
20150526_20150607_F1_amp.tif
20150526_20150607_F1_color_phase.kmz
20150526_20150607_F1_color_phase.png
20150526_20150607_F1_corr.tif
20150526_20150607_F1_unw_phase.kmz
20150526_20150607_F1_unw_phase.png
20150526_20150607_F1_unw_phase.tif
20150526_20150607_F2_amp.tif
20150526_20150607_F2_color_phase.kmz
20150526_20150607_F2_color_phase.png
20150526_20150607_F2_corr.tif
20150526_20150607_F2_unw_phase.kmz
20150526_20150607_F2_unw_phase.png
20150526_20150607_F2_unw_phase.tif
20150526_20150607_F3_amp.tif
20150526_20150607_F3_color_phase.kmz
20150526_20150607_F3_color_phase.png
20150526_20150607_F3_corr.tif
20150526_20150607_F3_unw_phase.kmz
20150526_20150607_F3_unw_phase.png
20150526_20150607_F3_unw_phase.tif
The files are as follows:
| F? | swath designator, F1, F2, or F3 |
| amp | amplitude image |
| corr | coherence map |
| color_phase | wrapped phase file |
| unw_phase | unwrapped phase file |
With extensions:
| .kmz | Google Earth KMZ format |
| .tif | GeoTIFF format |
| .png | Portable Network Graphic (browse image) |
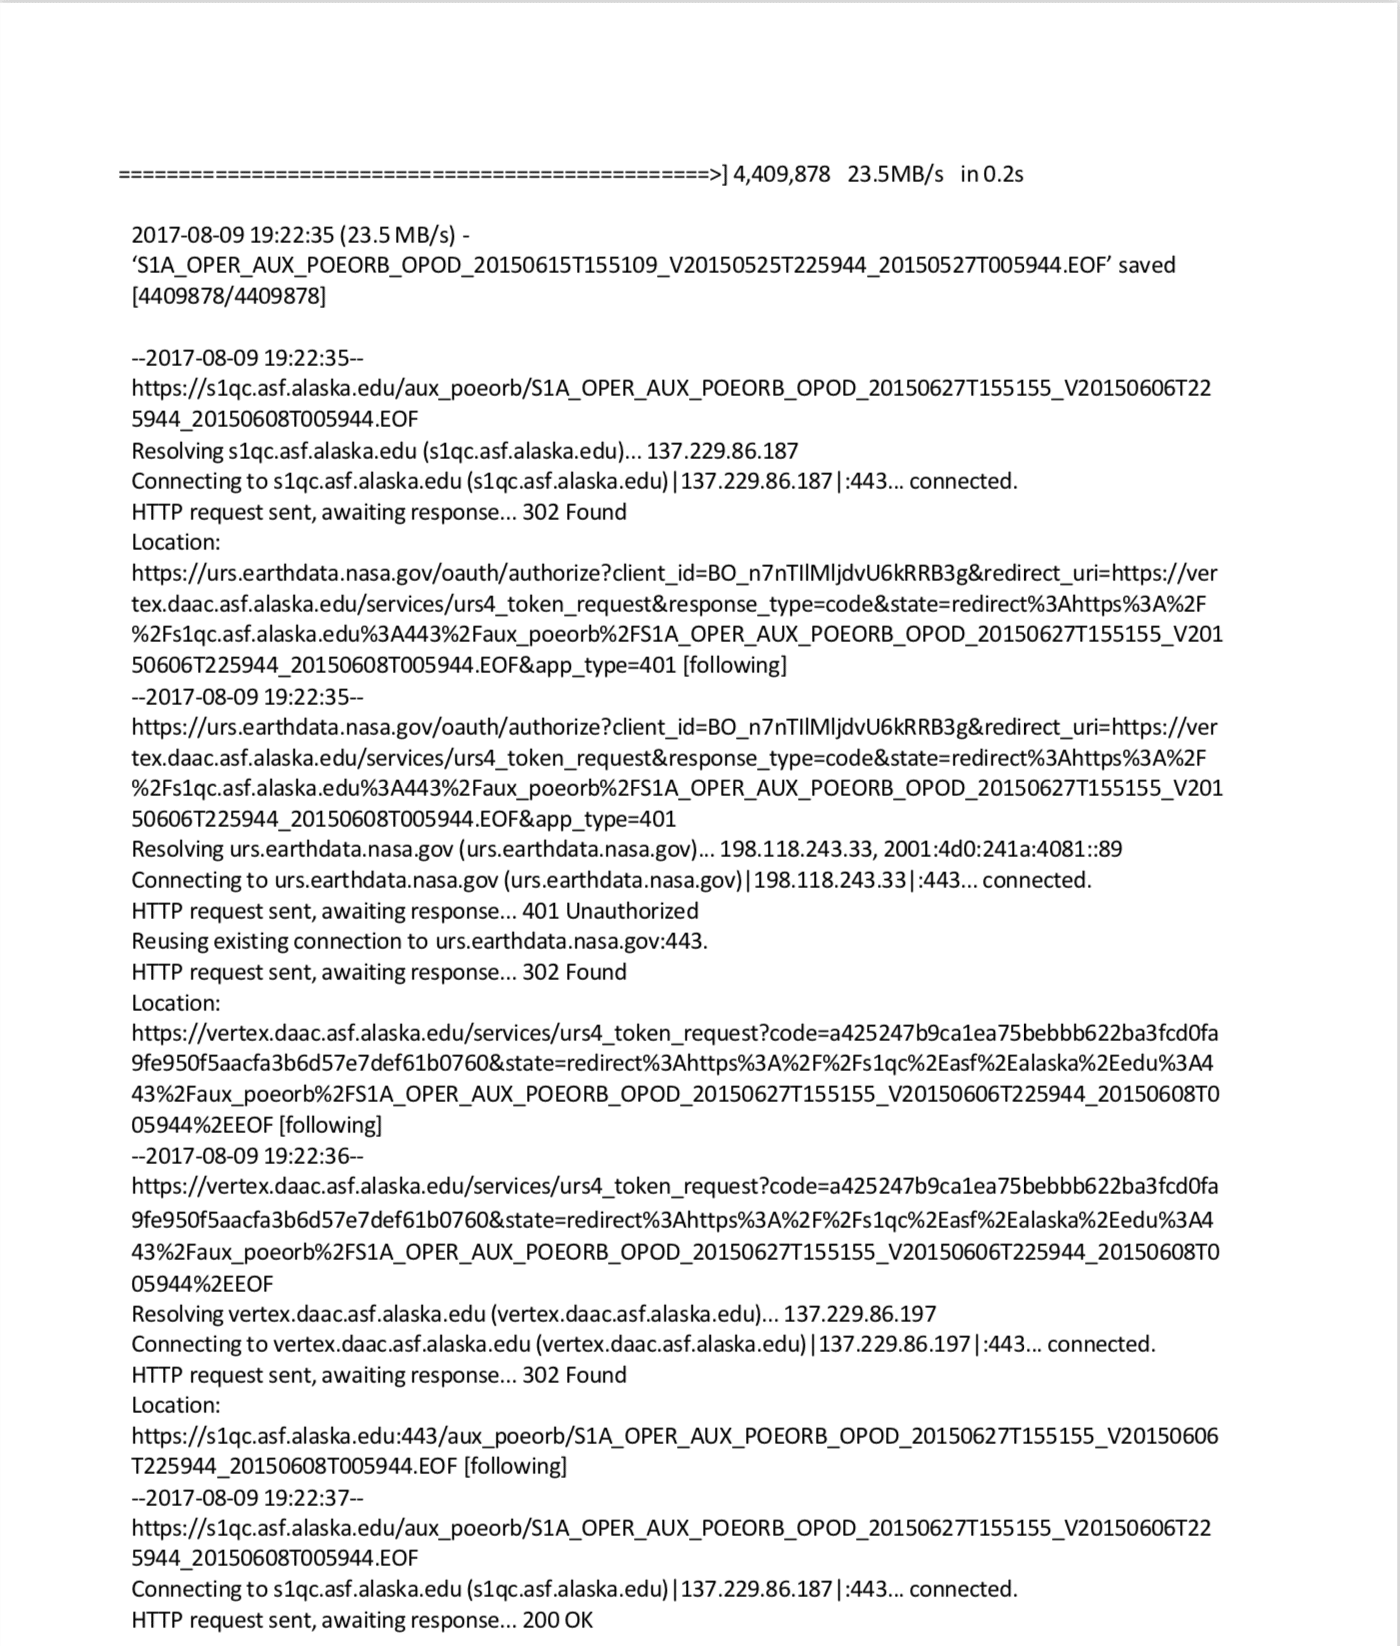
Appendix 3: Sample Script Run
The output from an example run, using the same LA data used in the GMT5SAR example, is as follows:
python procS1GMT5SAR.py
S1A_IW_SLC 1SSV_20150526T014935_20150526T015002_006086_007E23_679A.zip
S1A_IW_SLC 1SDV_20150607T014936_20150607T015003_006261_00832E_3626.zip